Analytics at its finest with Google Analytics
Google Analytics is a great tool for businesses. Any website should typically have this. Why? its a lot of free information on where your web site viewers are coming from, what they are looking at, for how long, and much more!
There are some super powerful elements of it but for today we’re going to look at some basic terminology.
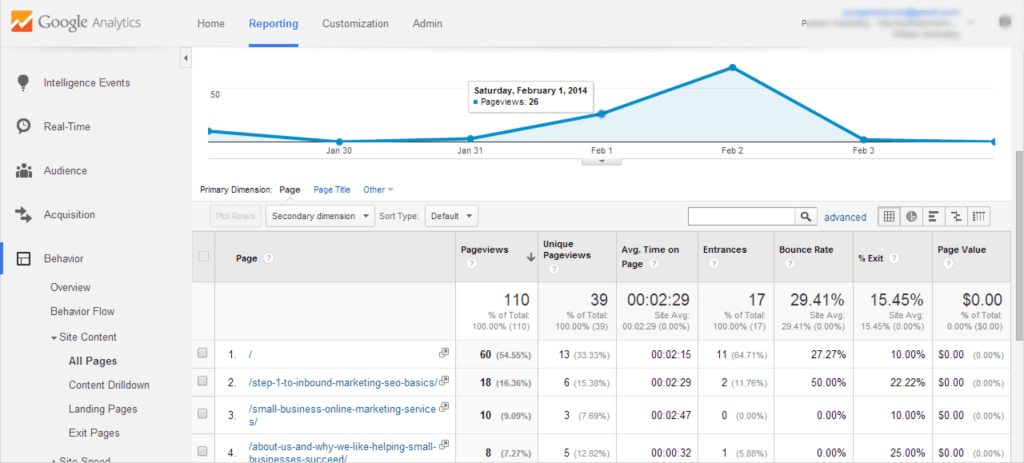
To get started, take a gander at the chart below:
So here is a quick glance at my websites visits by content. This enables me to look at what my most popular pages are and understand what is going on in my website.
To understand what the chart means, here are some definitions of keywords:
PageViews:
The total amount of times the individual page has been viewed.
Unique Pageviews:
The amount of individual IP addresses (desktop, laptop, mobile phone, etc.) that have viewed your web page.
Avg. Time on Page:
The average amount of time someone stayed on your page, regardless of activity on that page. This means they could have viewed the page and walked away from their computer and the timer is still counting.
Entrances:
The number of times people entered your website from a specific page.
Bounce Rate:
The percentage of individual page visits. This can be if someone visited your home page and then immediately left. A “healthy bounce-rate” is actually between 30%-35% for most applications. However there are times it makes sense to have a high bounce rate which we will address later.
% Exit:
The percentage of people exiting your website from a page divided by the number of that page’s views. “It indicates how often users exit from that page or set of pages when they view the page(s) (Google).” An example of this is my Home page from the above chart. The individual page has a 10% Exit. This means that six times out of 60 page views, a person left my website.
Page Value:
In Google Analytics, you are able to set a dollar value on each individual page, a value you set based upon potential transactions and revenue. We won’t be addressing these today since that is an advanced feature in Google Analytics.
So what does it all mean?
I’ll be honest… it depends.
For example, some websites you really don’t need people staying on your website for more than four minutes. But if its a blog with some great articles, then sure 5-12 minutes is appropriate. If your blog has an average less than two minutes, then there is a problem and you’ll have to dig deeper to either fix your content or the way its presented.
Another example is your bounce rates. A landing page may exceed 70% and that is perfectly normal. A web store might experience a lower one around 20%. It just kind of depends. Some people may disagree with my statement that 30%-35% is a “healthy” bounce rate. However I feel if you have good engaging content and a good product, than you should not have a landing page that skews your site average above 50%.
So what does Google Analytics actually do for me?
Google Analytics wont fix your site, but it is a tool that allows you to know whether your site is healthy or not. If your noticing an extremely high bounce rate on your home page, then you need need to fix your content, design or both. If your blog articles have an average of 45 seconds view time, and they are 5 pages long, then there is a problem with the content.
Google Analytics helps you identify problems and build a better website for your customers.
Need help setting it up or analyzing your analytics? Feel free to:
Call 509-240-9735
Catch me on twitter at: https://twitter.com/YourAdAgency_
Email me Adam@PullmanMarketing.com


